Identifying where and when urban renewal occurs: a continuous change detection-based framework using two decades' worth of Landsat data

Publication
International Journal of Digital Earth

Urban Renewal & Remote Sensing

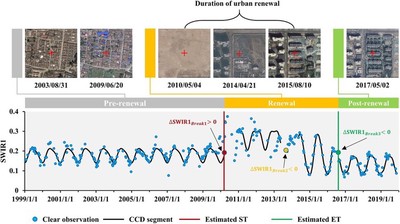
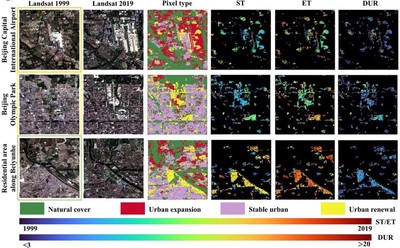
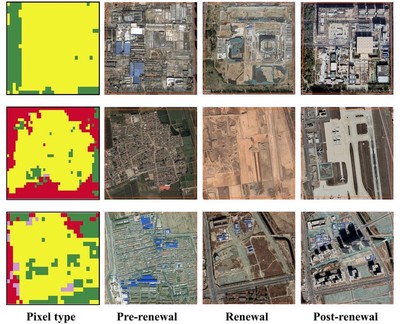
🏙️ What if satellites could tell us when a city breathes, rebuilds, and transforms? A new study used 20 years of Landsat satellite data to map urban renewal in Beijing—capturing not just where old buildings were torn down and rebuilt, but when and how fast the changes happened.

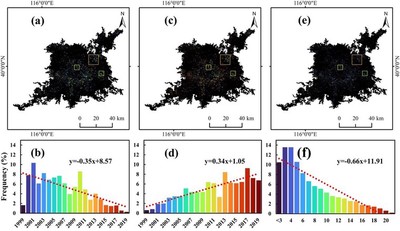
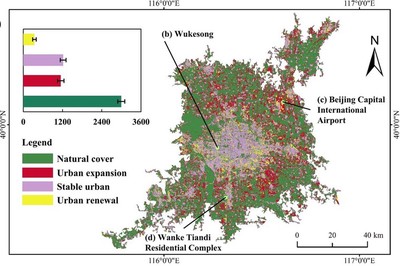
🛰️ Using an algorithm called CCDC, researchers identified over 340 km² of renewed urban space between 1999–2019. Most projects wrapped up in under 5 years—revealing a pattern of “quick demolition and reconstruction” that shaped the city’s core.

🌱 Why it matters? Understanding how and when cities change helps us design more equitable, sustainable urban futures.

Figure 1: Illustration of estimating three temporal metrics of urban renewal at one example pixel.
Figure 2: Spatial and temporal distributions of estimated urban renewal time information (Part A).
Figure 4: Spatial and temporal distributions of estimated urban renewal time information (Part B).
Figure 3: Map of urban renewal distribution for the study area (Part A).
Figure 5: Map of urban renewal distribution for the study area (Part B).


Author: Qi Zhang
Updated: June 2025

Chong Liu
Chong Liu
Associate Professor

Remote Sensing Geographer

Qi Zhang
Qi Zhang
Research Assistant Professor

Human-Environment Geographer

Related